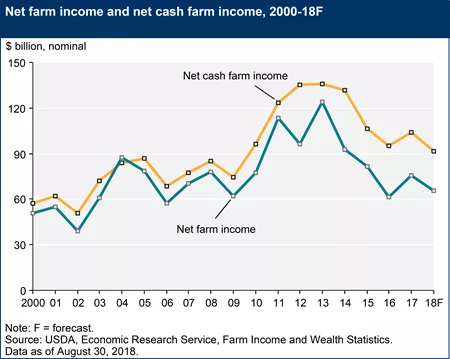
Net farm income, a broad measure of profits, is forecast to decrease $9.8 billion (13.0%) from 2017 to $65.7 billion in 2018, after increasing $13.9 billion (22.5%) in 2017, according to USDA's Economic Research Service.
Net cash farm income is forecast to decrease $12.4 billion (12.0%) to $91.5 billion. In inflation-adjusted 2018 dollars, net farm income is forecast to decline $11.4 billion (14.8%) from 2017 after increasing $13.0 billion (20.3%) in 2017. If realized, inflation-adjusted net farm income would be just slightly above its level in 2016, which was its lowest level since 2002. Inflation-adjusted net cash farm income is forecast to decline $14.6 billion (13.8%) from 2017 to $91.5 billion, which would be the lowest real-dollar level since 2009. Net cash farm income encompasses cash receipts from farming as well as farm-related income, including government payments, minus cash expenses. Net farm income is a more comprehensive measure that incorporates noncash items, including changes in inventories, economic depreciation, and gross imputed rental income of operator dwellings.
Note: The 2018 forecasts for U.S. farm sector income and finances—including government payments, net farm income, and net cash farm income—do not include payments under the Market Facilitation Program (MFP), announced on July 24, 2018. Details released August 27, 2018 on the package to assist farmers in response to trade disputes are here. ERS forecasts are developed assuming a continuation of existing policies. At the time the August forecast was released, it was too early to tell how many producers would complete the MFP enrollment process and receive a payment in 2018 versus 2019, or how the eligibility criteria would impact the total level of payments issued (which would change calendar-year 2018 farm income totals).
The farm business average net cash farm income is forecast to decline $16,600 (19.9%) to $66,700 in 2018. This would be the 4th consecutive decline since 2014 and the lowest average income recorded since the series began in 2010. All categories of farm businesses are expected to see declines with dairy farm businesses expected to see the largest decline. Every resource region of the country is forecast to see farm business average net cash farm income decline as well.
Farm sector equity is forecast up by $21.8 billion (0.8%) to $2.62 trillion in 2018. Farm assets are forecast to increase by $35.6 billion (1.2%) to $3.0 trillion in 2018, reflecting an anticipated 1.8% rise in farm sector real estate value. Farm debt is forecast to increase by $13.8 billion (3.5%) to $406.9 billion, led by an expected 4.4% rise in real estate debt. The farm sector debt-to-asset ratio is expected to rise while the total rate of return to farm assets is expected to decline in 2018.


